The Kinneret – The Sea of Galilee Historical and Current Level
The data for these graphs comes from the Israeli Govt Water Authority site here. They usually post new numbers Sunday to Thursday. I have managed to download a complete historical set of numbers from their site. I also tweet the level out whenever new numbers are released. You can find the latest tweet here.
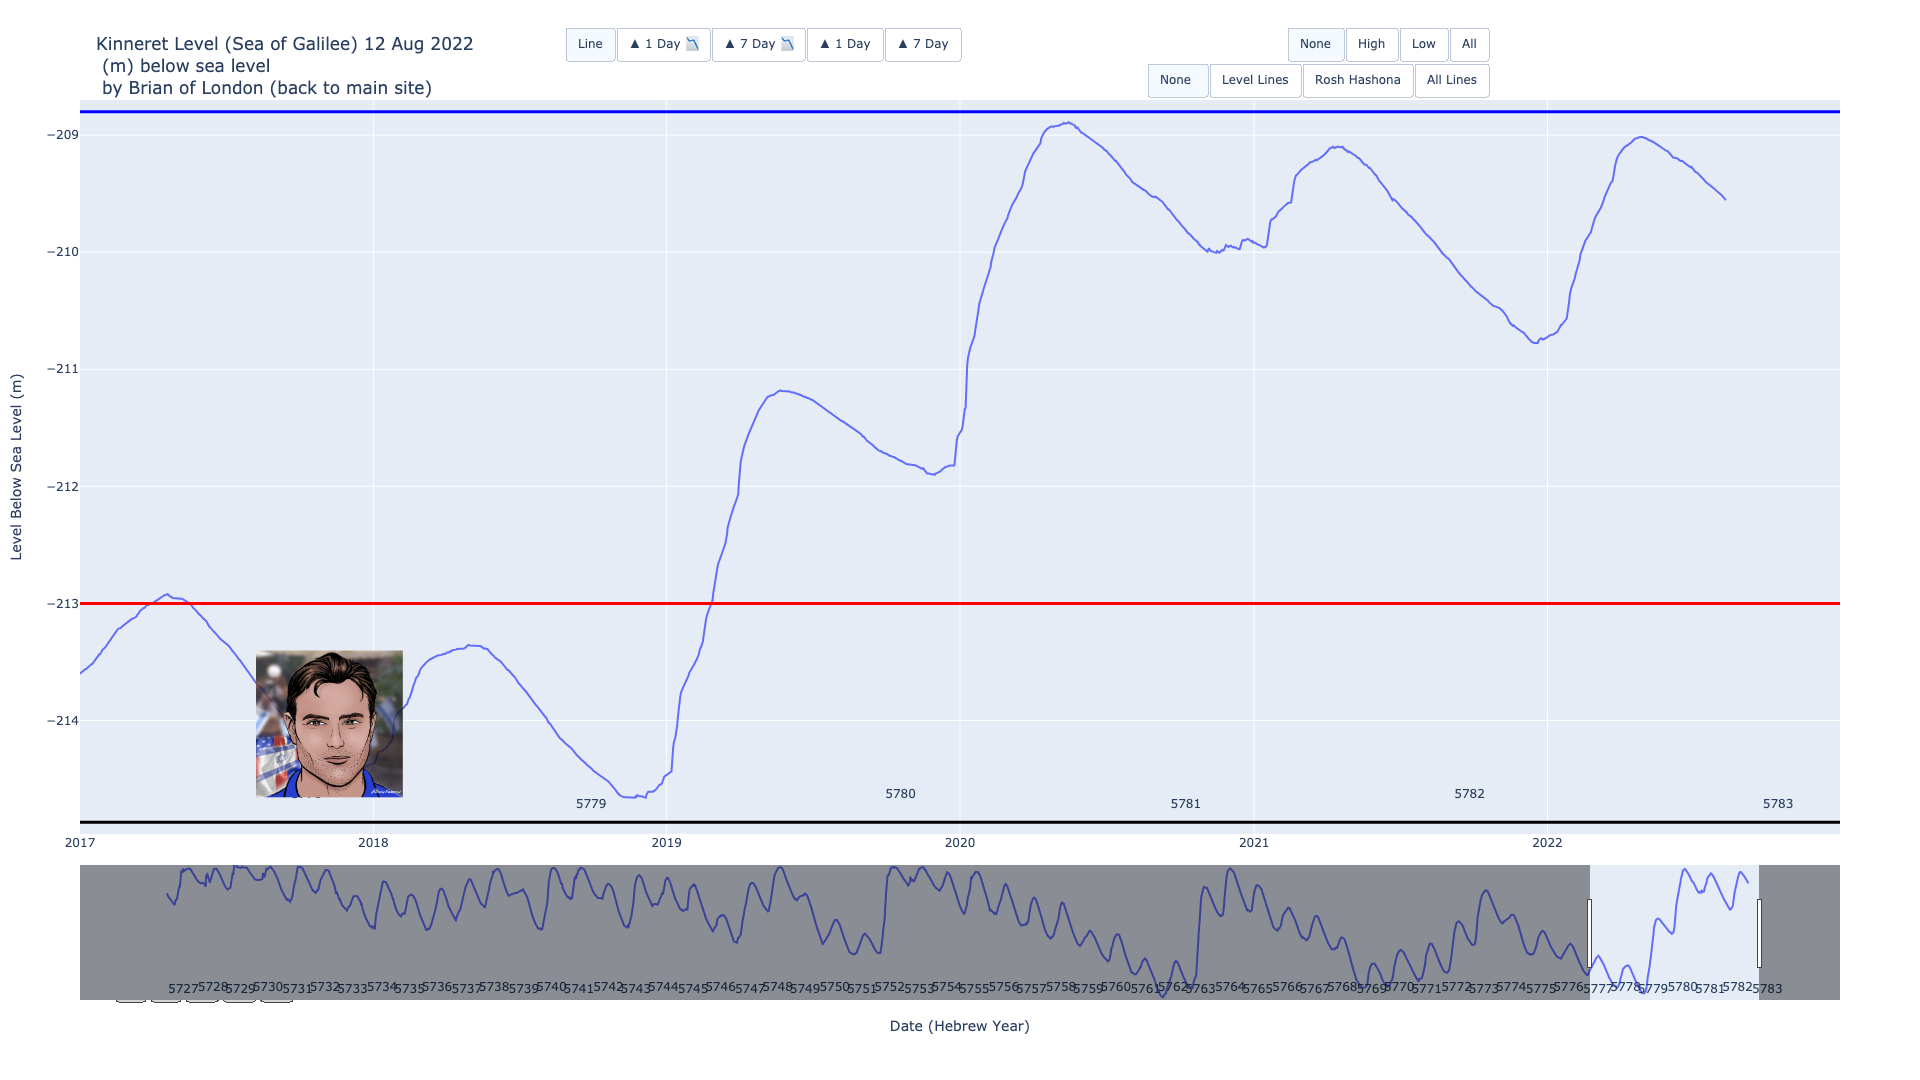
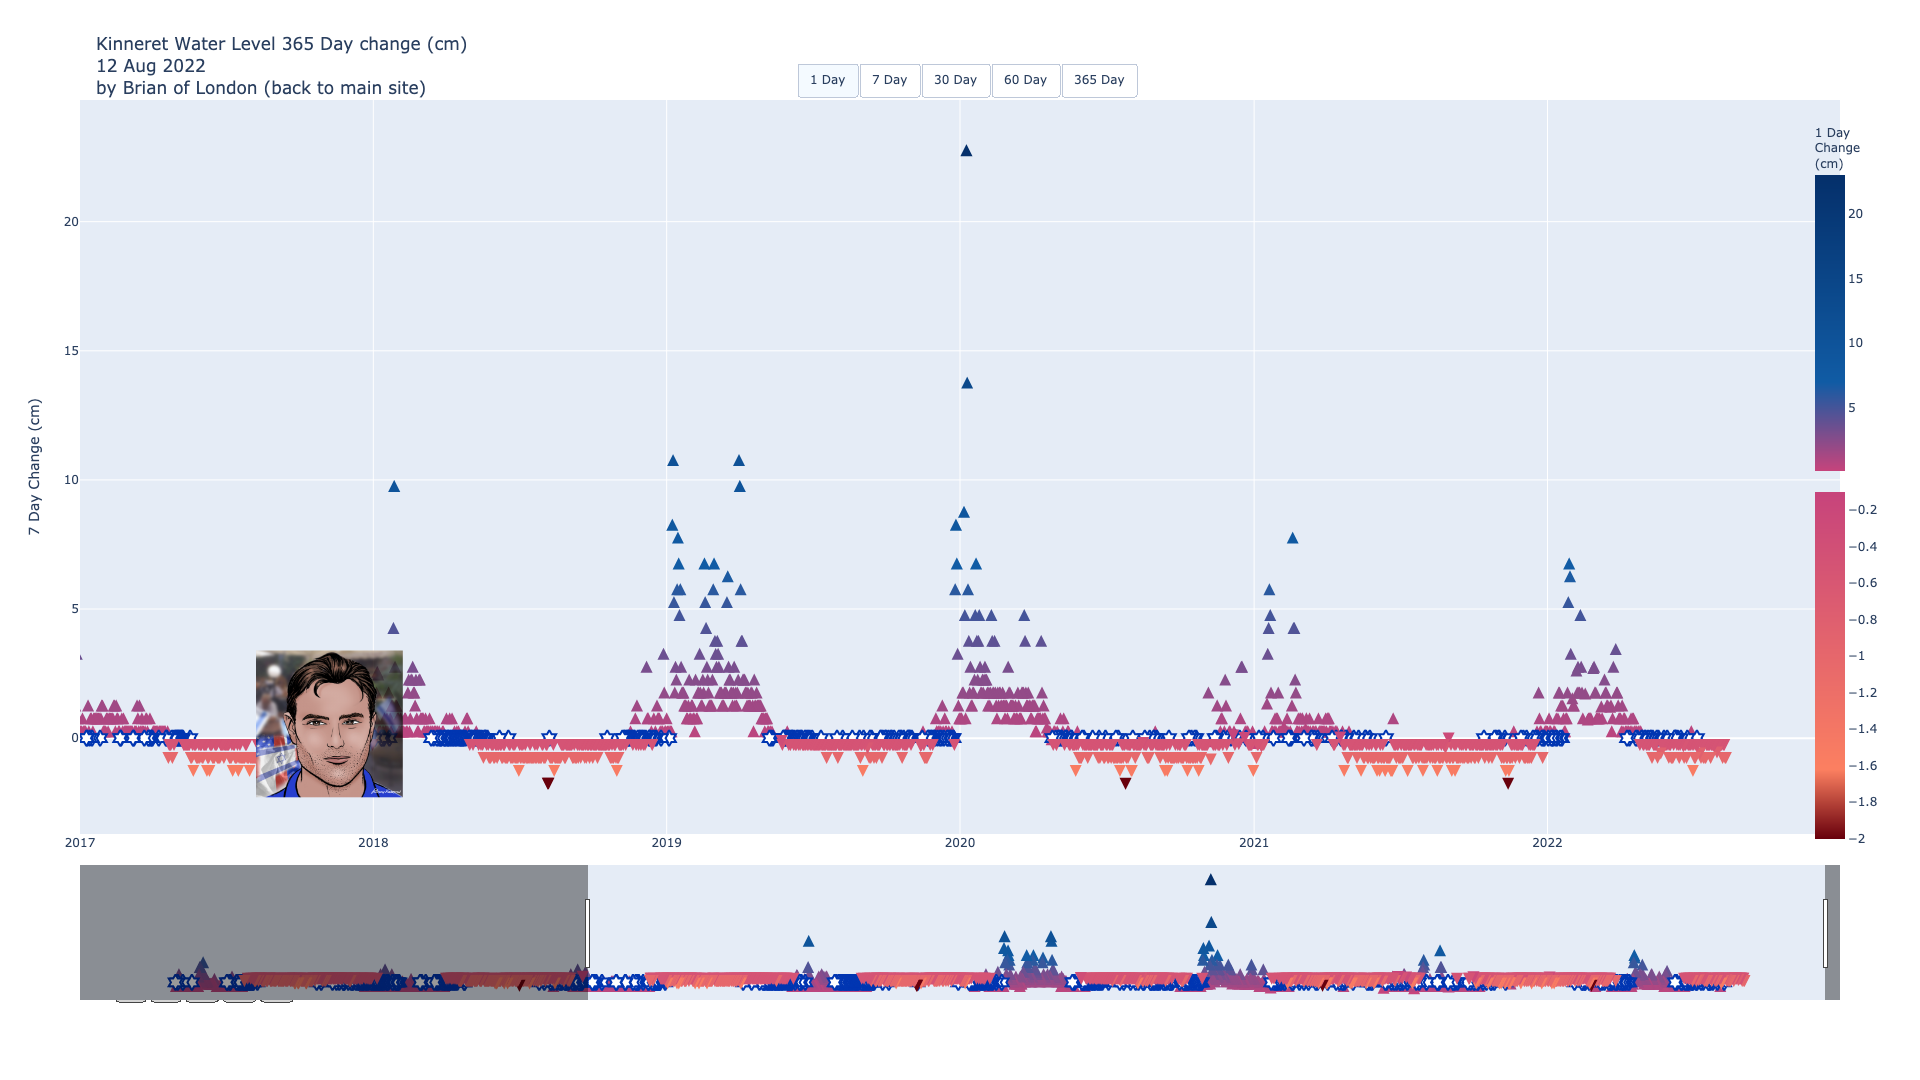
Click on the Images to be taken to interactive graphs of the level of the Kinneret, the Sea of Galilee in Israel.
The interactive version of this graph lets you explore the level of The Kinneret (The Sea of Galilee) back to 1965. Use the menu buttons to show various other information including the days on which the lake was at its highest and lowest each year.This interactive graph shows the changes in the level of The Kinneret (Sea of Galilee) on a daily, weekly, monthly and even annual basis. arrows show which direction the lake was moving on a given day and the colour indicates the rate of change.